Bank of England Chief Economist, Andy Haldane stated in his latest interview, that property is a better investment for retirement than a pension. But what are the facts? Is this view misguided?
Since Andy Haldane’s comment last Sunday, I have read self-interested nonsense from a pensions expert claiming that Haldane was wrong because pensions were cheap to run, typically costing around 0.75% pa as compared to up to 10% pa to run a property.
This is patent nonsense as many can simply choose to buy a larger house to live in rather than have to have someone else manage a property. It was pretty obvious that Mr Haldane was talking about houses rather than commercial properties. Similarly, this expert seems to have forgotten the costs that his own platform that charges of up to 0.45% a year on top of any fund costs (let alone the hidden fund manager dealing costs).
Instead of focusing on the costs and the associated taxes of one option against the other, which will vary enormously for each individual depending on how (and who) they choose to manage their pension or their property, it is worth interrogating the actual facts of house price returns vs share returns.
I have looked at long time periods to reflect that pensions tend to have a long term investment horizon (unlike Andy Haldane). I researched both the UK and the US house prices vs equity prices using the main equity indexes (S&P 500 for the US and FTSE All-Share for the UK). Then compared this with two leading house price indexes, the Federal Housing Finance Agency US House Price Index for the US, and the Nationwide All Houses Price Index for the UK. I compared the US index from March 1988 and the UK since January 1986 (being the longest period in which I could obtain detailed total return data for both the FTSE All-Share Index and S&P 500 Index).
Critics may find reasons why such start dates are unfair, so I then compared the returns of UK and US house prices against UK and US share prices over every quarterly 20-year period since the start, and calculated the chances of shares beating property in each market.
Here are the results:
UK shares Vs UK houses – annualised return UK shares 9.5% pa vs 5.9% pa UK houses
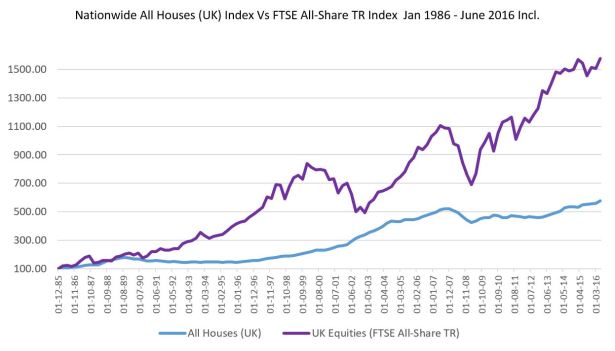
Sources: SCM Direct, Nationwide, Bloomberg
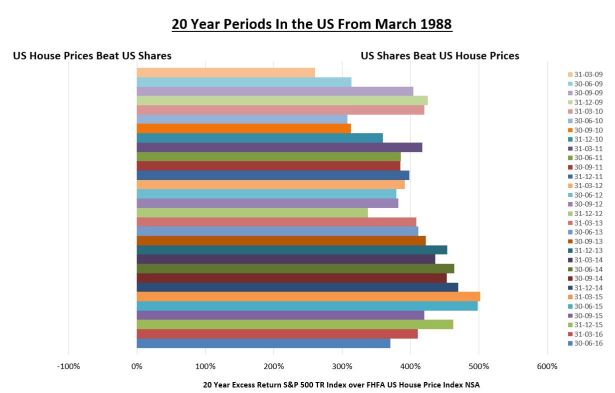
US shares Vs US houses – annualised return US shares 10.1% pa vs 3.3% pa US Houses
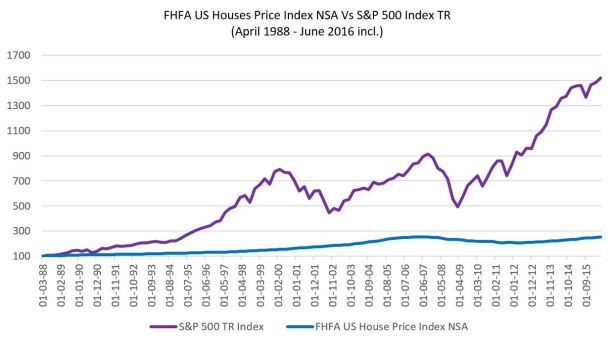
Sources: SCM Direct, FHFA, Bloomberg
Looking at the 20 year periods
UK – the average outperformance of UK equities against UK house prices over 20 years, analysing 43 quarterly 20-year time periods since the start of 1986, was 184% and shares beat houses in 91% of the periods analysed.
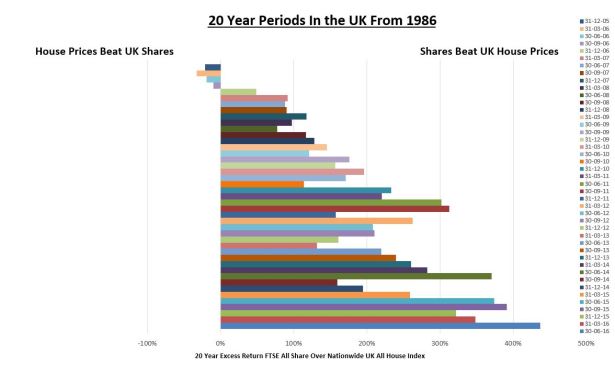
Sources: SCM Direct, Nationwide, Bloomberg
US – the average outperformance of US equities against US house prices over 20 years, analysing 30 quarterly 20-year time periods since the end of March 1988, was 402% and shares beat houses in every single period analysed.
Sources: SCM Direct, FHFA, Bloomberg
Maybe Mr. Haldane as a trained economist should look at the data before making damaging and irresponsible comments and conclusions. Of course, he might say that this was the past and it will be different in the future – however given the statistics on house price data against incomes, it is hard not to conclude that UK house prices are already ridiculously over-valued:
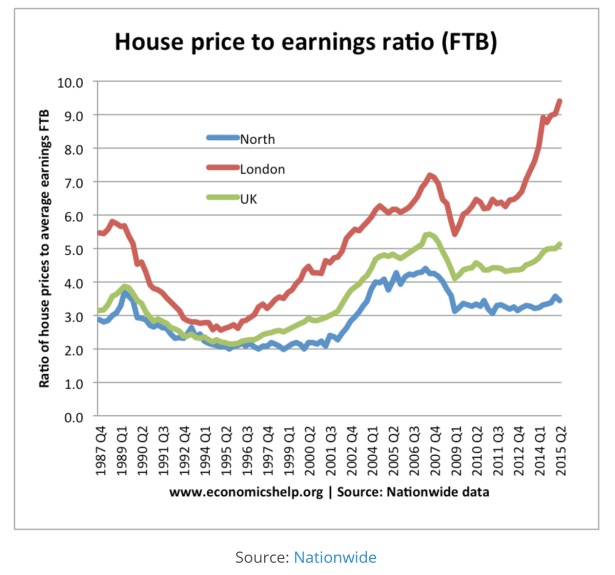
If we forecast future UK share price returns over the next 10-15 years based on the ratio of UK share prices to the smoothed corporate earnings of UK Companies (known as the CAPE Ratio), this would predict UK shares to grow at 7.5% pa[1]. In comparison, were the ratio of house prices in 10 years-time to simply fall back from 5x to a more normal 4x and the average income rose by 3% pa (the growth in average weekly earnings since January 2000), this would imply that UK house prices would rise by just 0.7% pa. Thus over 10 years you would be 99% better off having bought UK shares than a UK House.
Sorry Mr Haldane – looks like you’re going to have to delay your retirement if you choose to buy that house rather than those shares.
[1] https://www.researchaffiliates.com/en_us/asset-allocation/equities.html